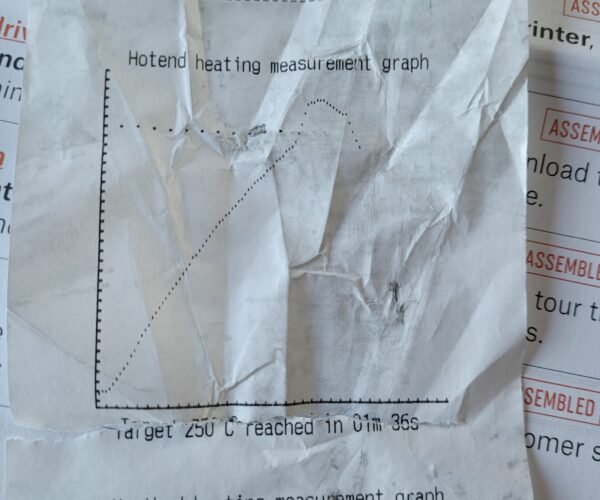
Prusa Testing Protocol heating measurement times, Graph doesn't match reported time
I just opened by printer and it included graphs of the temp for the hotend and heatbed. I was concerned that despite saying the hotend passed by heating to 250c in a time of 2m 30s, the included graph showed a time of over an hour (1h 1m 36s) to reach the target temp for the hotend and was wondering if that was a normal reading and if it would take that long to heat up once assembled or not. How exactly is that graph generated and why is it different than the reported passing times?
The generated testing protocol sheet also was torn right across that reported time so not sure if there was just a problem and instead of addressing it someone tried to hide it in some way. Don't mean to be suspicious but it just concerned me.
RE: Prusa Testing Protocol heating measurement times, Graph doesn't match reported time
Sorry, I'm new to this forum and just realized I posted to the wrong section, this is a mk3s+. Don't see how to delete and thankyou.
RE: Prusa Testing Protocol heating measurement times, Graph doesn't match reported time
It s similar to the ones I have seen. I suspect that this might be a question that the company needs to answer. I have never questioned it. Contact support via chat and they might be able to get you an answer.
--------------------
Chuck H
3D Printer Review Blog
